Fun with Folium
I’ve been looking at mapping tools and decided to have a play with Folium, a python library for mapping. The aim was to see how easy to use it was, and whether it had the flexibility to present geographical data in a number of styles to enable me to display a range of data.
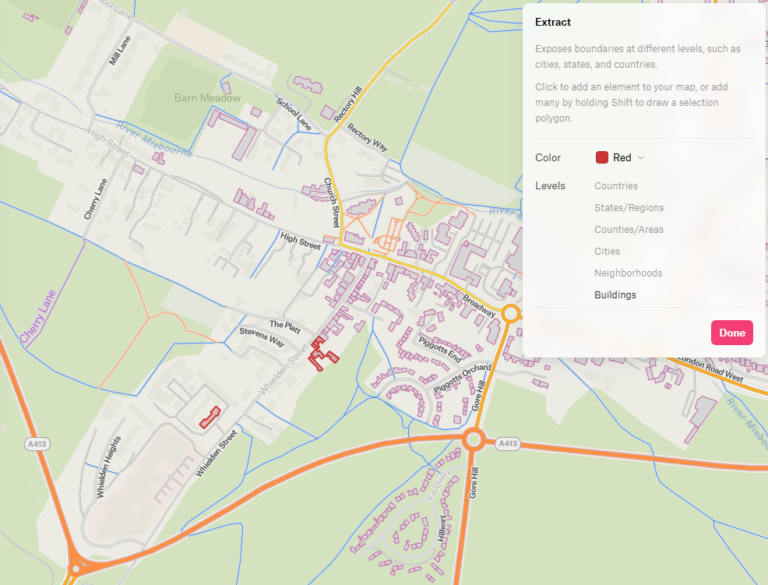
I already had some files outlining the buildings in Amersham, I was interested in seeing how Folium presented these. I extracted the buildings data as geojson, which is really easy to do from QGIS, which I might add a post about later.
The process of reading from the geojson file was also very straightforward, being the same as for almost any file, no additional packages needed. It was easy to check the data had loaded as well, particularly as I was familiar with the data and knew the names of the buildings.
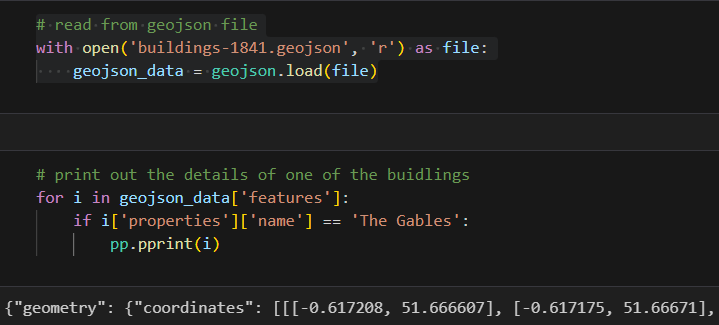
Manipulating the file in python is easy too, as it’s just json, which is pretty much universal, so it was easy to add some additional data to the file to add colour coding to some of the buildings. I decided to try using geopandas, though, as it seemed to also be a really useful tool, particularly as I was already familiar with pandas.
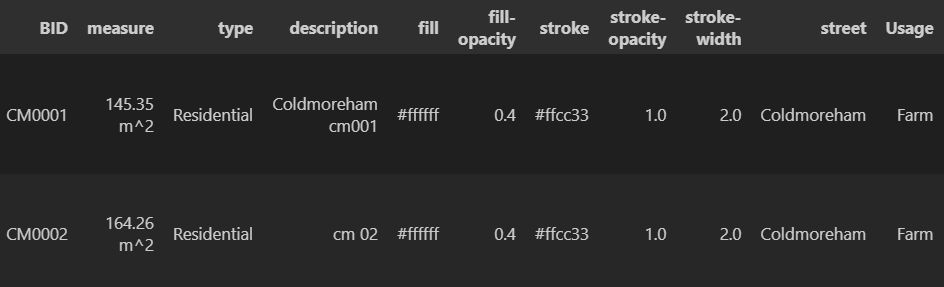
Basically, geopandas works in exactly the same way as pandas, so I was able to merge details of the usage of properties with my existing building drawings using merge, and apply colours and shading to each of the buildings according to their usage. So far, so simple.
I was really surprised, though, at how easy it is to create a map with Folium. you simply create the map with it’s parameters with one line of code, and add your drawings to it with another. Here’s one using Cartodb Positron as a basemap, as it’s muted colours allow the buildings to show up clearly.
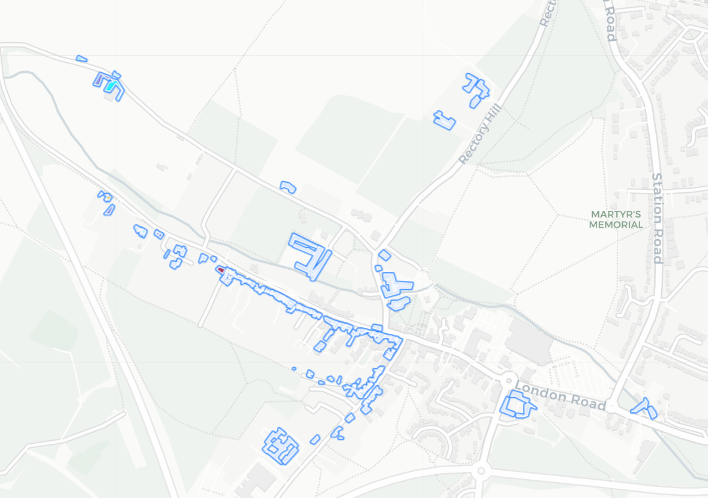
The issue that leaps out, though, is that the bypass and a lot of the buildings are contemporary. For most users this will be fine, and it’s what I would expect, however, if you’re trying to visualise data from the 1841 census, having a bypass that was only opened in 1987 (thanks to the wonderful SABRE Roader’s Digest for that info) seems a bit out of keeping.
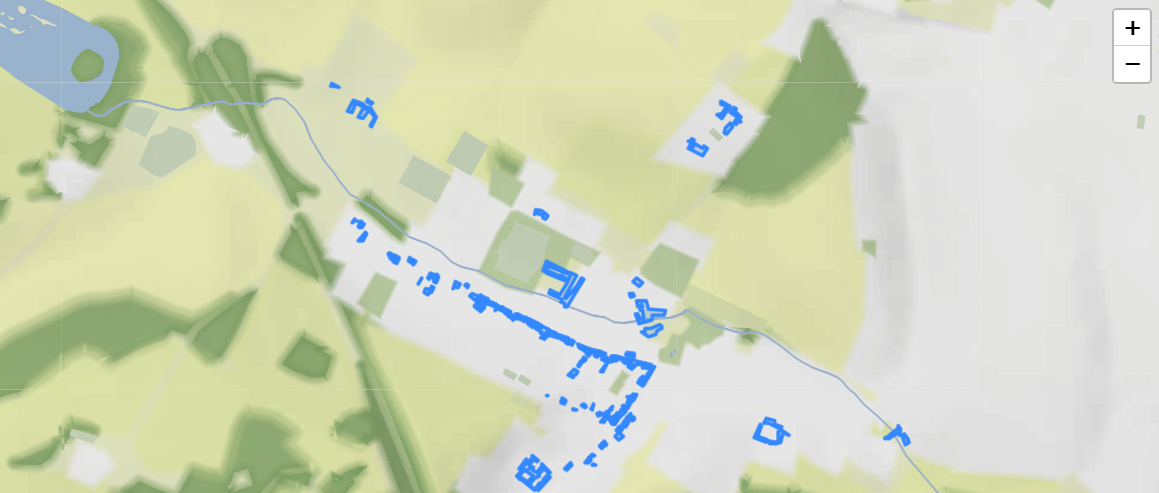
I tried adjusting the base map to use some of the lovely terrain maps from Stamen, but even choosing one with no roads and only the fields coloured in gives the same issue.
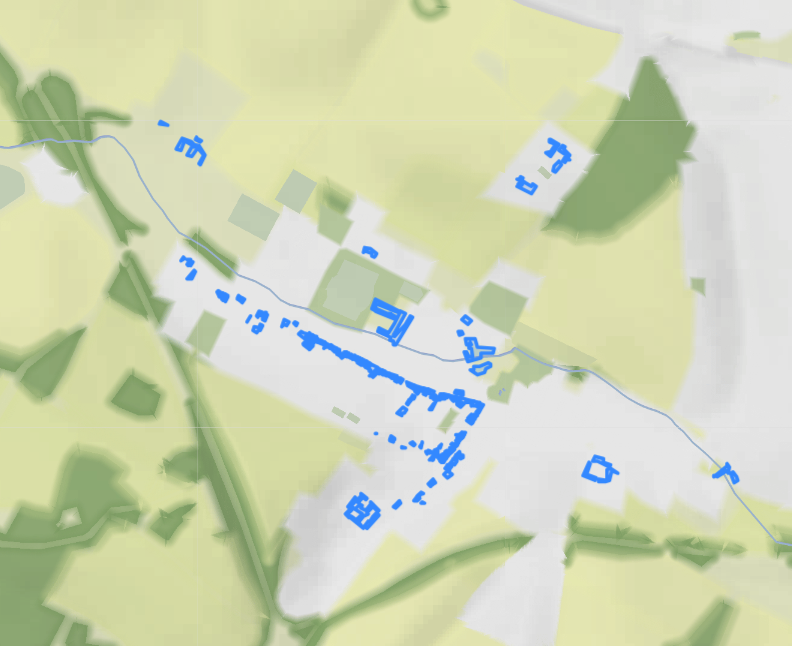
The bypass is visible due to the green verges either side of it, so it’s still visible, even without the roads being marked, and the grey areas of development, particularly in the north-east are also evidence of this being a contemporary map. Most of the houses in that area only arrived after the Metropolitan railway reached Amersham in 1892 (thanks Visit Amersham for your very useful local info page!).
I think it’s a great tool and will certainly be using it again for other tasks, it’s so easy to use. In this case, though, it’s not the right tool for the job.