QGIS and the trouble with tithes
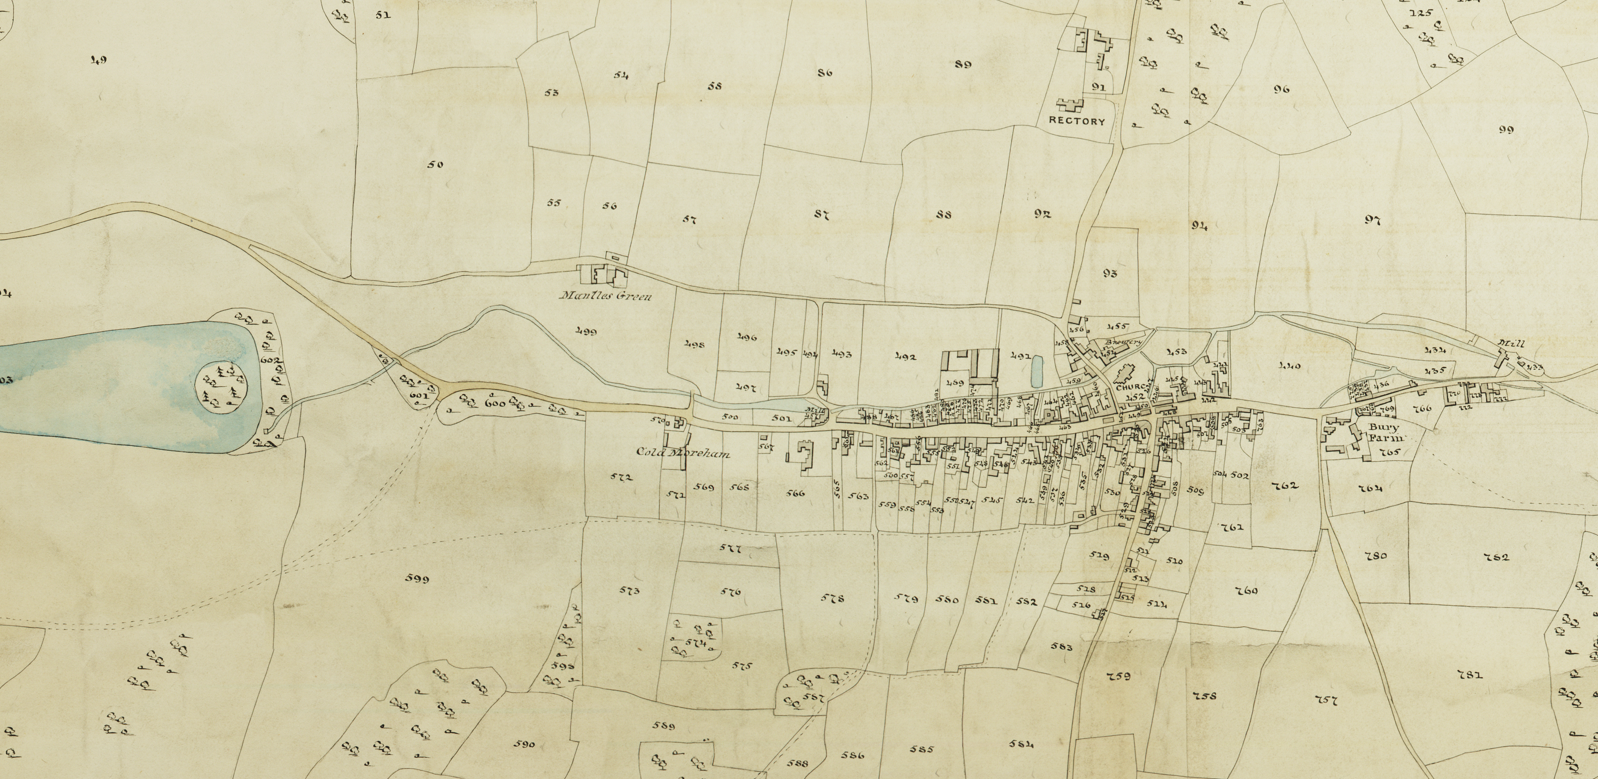
I’d wanted to recreate the historical landscape as a background for my town maps, so that the 1841 map drawings wouldn’t show the anachronous bypass around the town. I had visited Buckinghamshire Archives and had photos of the tithe map, as well as the accompanying book showing the name, owner, resident, size and rental value of the fields.
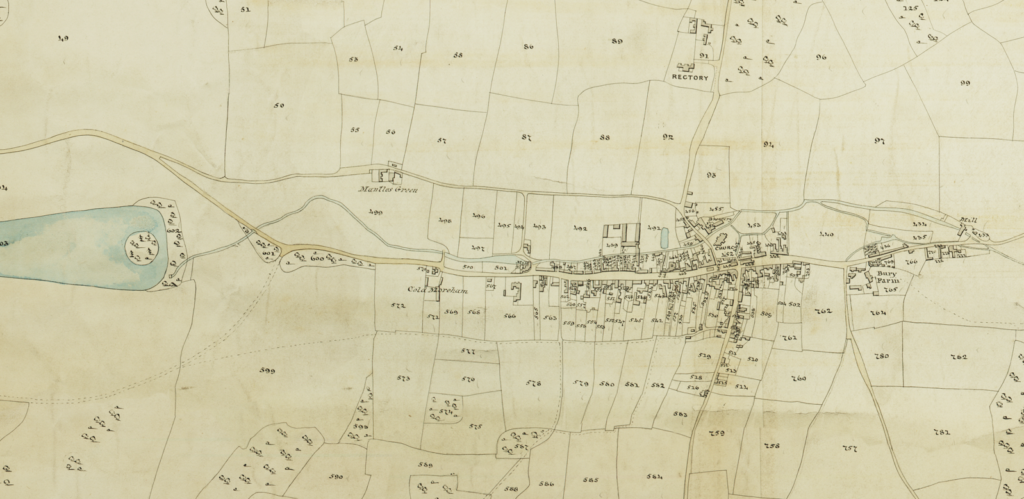
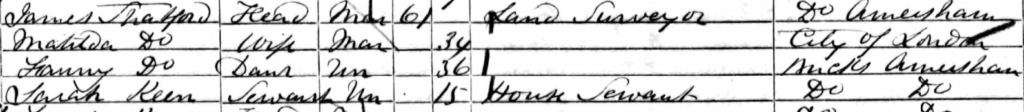
The map is a thing of beauty, hand drawn and coloured by J. Stratford, of Amersham. I know from the census records that this is James Stratford, who appears in both the 1841 and 1861 censuses, living on the High Street. It seems James was widowed at some point and by 1861 he is remarried to a woman that is 2 years younger that his daughter who is still living with them, which must have been a strange dynamic in the household.
Lovely as the map is, it’s not quite aligned in the way an OS map would be, and has no co-ordinates supplied, so in order to use it to create the fields, I had to add georeferencing myself in QGIS. This isn’t such a tricky process once you know how, it’s simply a case of:
- select the georeferencer from the Layer menu
- load the vector (image) into the georeferencer
- click on a point on the loaded image, the corner of a building is usually a good choice
- chose ‘Select from map canvas’, and click on the same point on your existing map
- repeat the point creation process until you’ve got a good number of points, at least 10, but more for a large map. Try to keep most of them close to the details you’re most interested in, in my case the main part of Amersham old town
- If you need to reposition, use the hand tool to move, then click on ‘Add GCP point’ to start adding again
- Hit run on the georeferencer once you’re ready, you’ll be prompted to give the georeferenced image a name and decide if you want it loaded in the project, most importantly it asks for the transformation type and resampling method, Thin Plate Spline and Cubic-B-Spline are a good bet. If you name your layer to include the choices you made, you’ll be able to try a few to see which gives the best results. Once you’ve done this, click the play button again
That’s for older maps, of course, the more modern maps only require you co click in the corners and add the co-ordinates as supplied on the map, a much more straightforward process.
Now I note it down it seems like a lot of steps, but none of them are individually too onerous. It takes some time to georeference, a good time to get yourself a cuppa, you’ll return to a beautifully georeferenced map, that you can then use to create your own maps from. If you’re not happy with the results, try tinkering with the transformation type and resampling method.
Spline methods will skew the map rather than trying to stretch or shrink the map to fit, so for older maps that may not be correctly aligned, as this tithe map wasn’t, they give better results. Spline methods do take a lot longer though, so you’ll have to wait for your results. Maybe get a biscuit while you’re waiting, too.
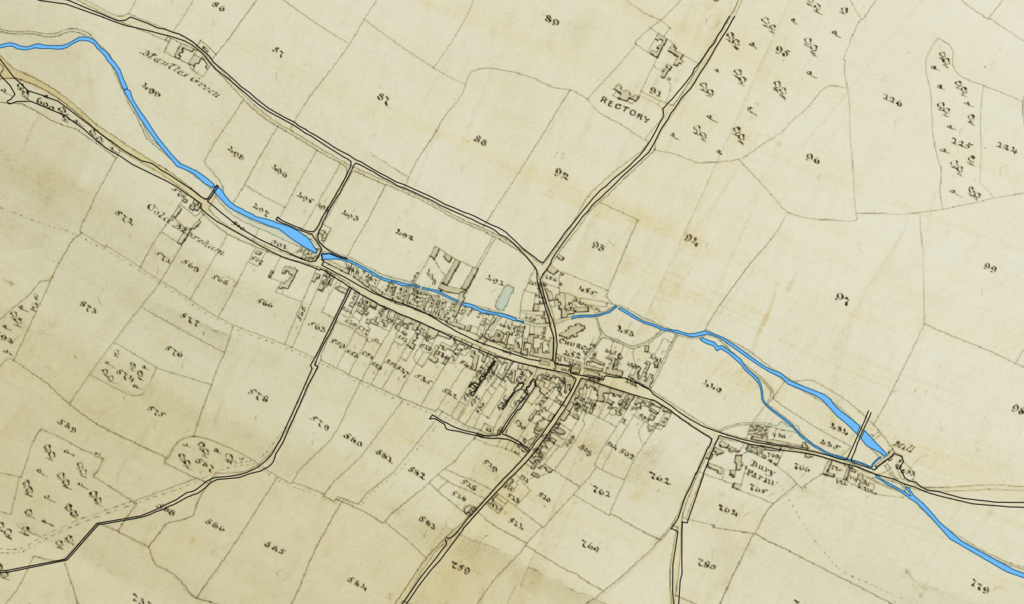
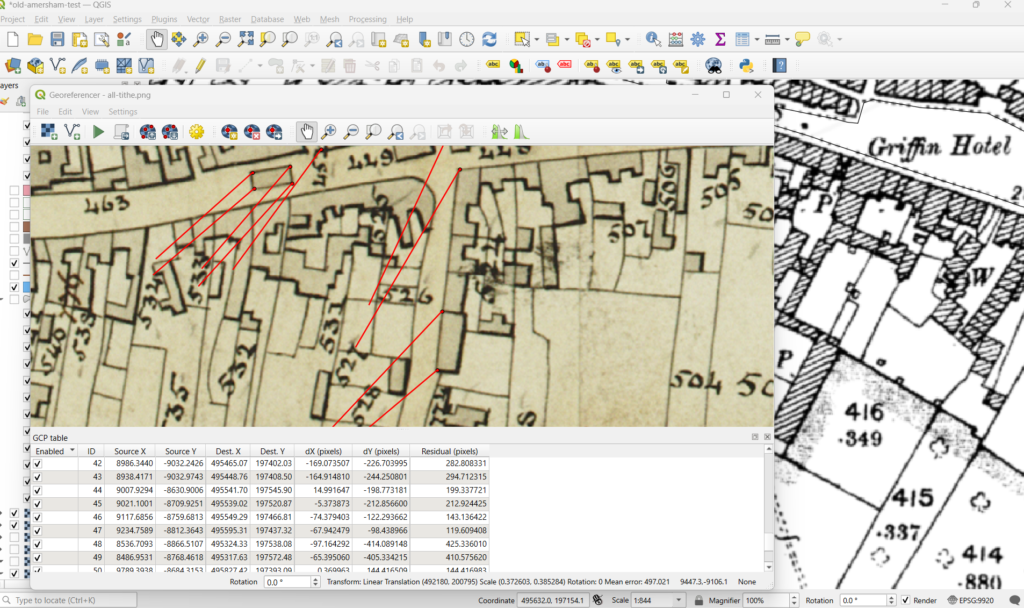
With older maps, such as the tithe map I was working with, the proportions won’t be exact and some of it will be skewed, especially as you get farther out on the map. You can see in the image above how the roads and water from a later, more accurate map diverge from the tithe. All of the important features are in the right place though, and I can use this to draw the fields for my map.